Anyone can learn to map data!
Links
CV
Google Scholar
Publications
Presentations
ORCID
Courses
Workshops
Mapping Science Exhibit
CNS YouTube Channel
About
Research
Art & Design
Teaching
Service
Contact
About
Research
Recent Publications
Books
Art & Design
Macroscopes
Humanexus
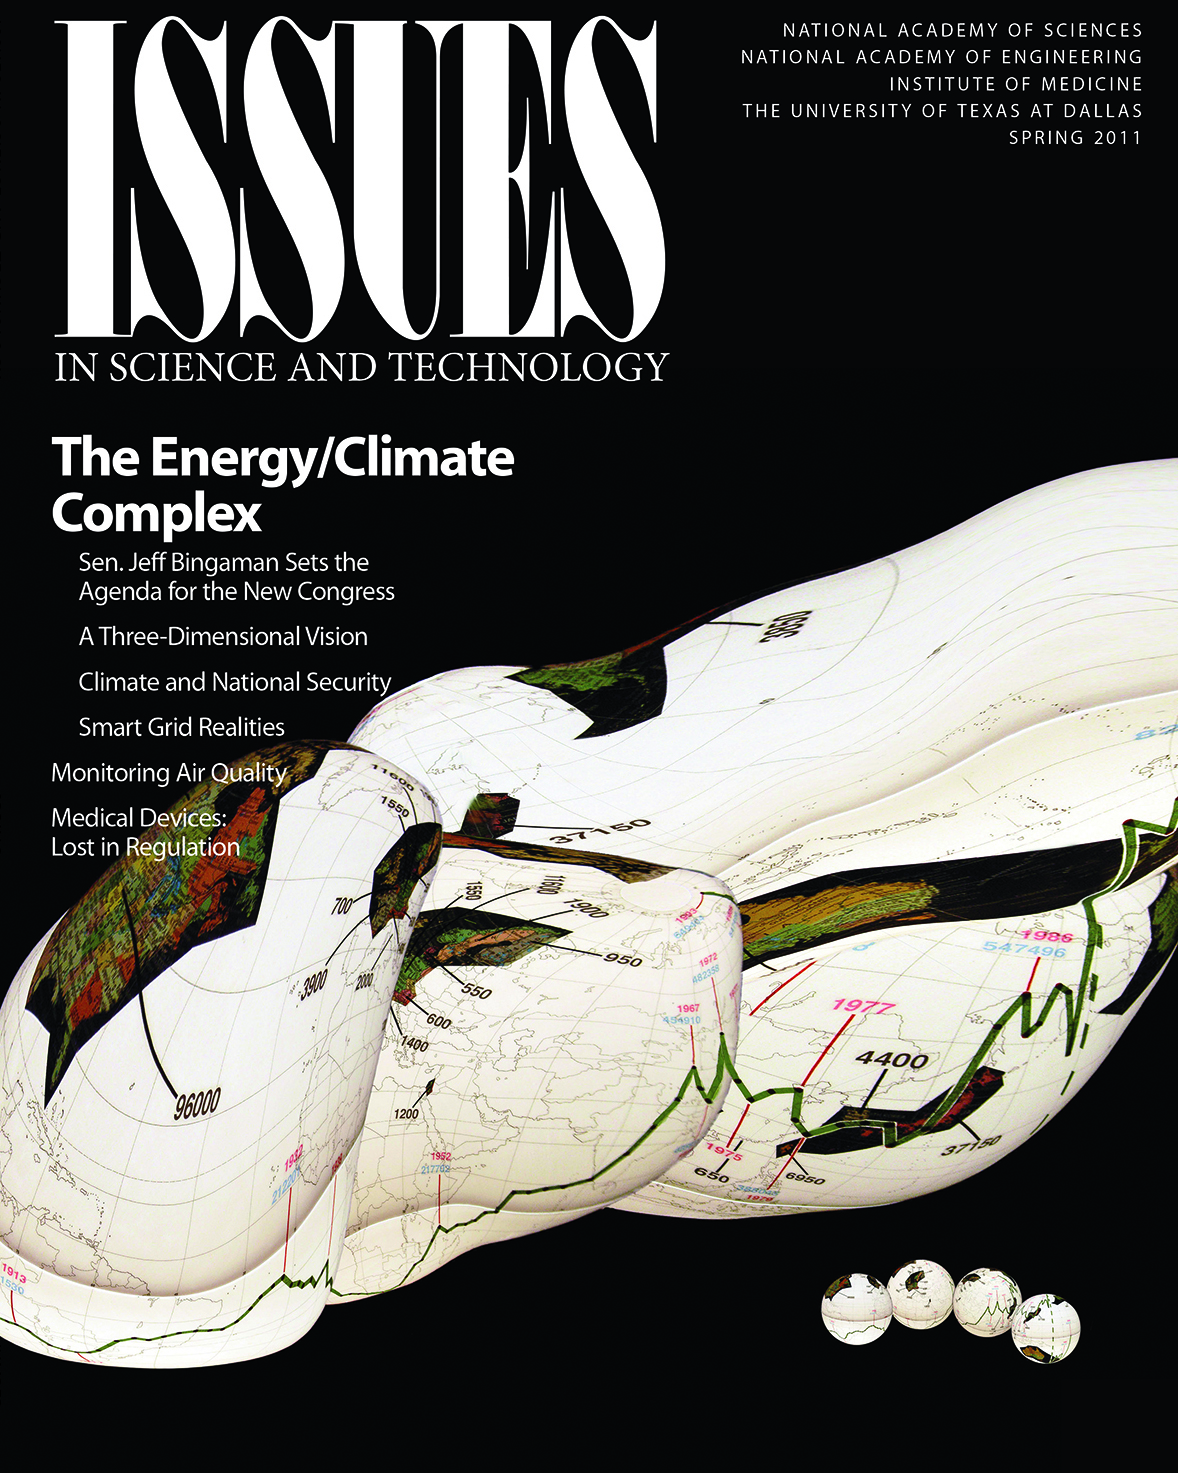
WorldProcessor Globes
Shape of Science Sculpture
Adventures in Knowledge Land
Science Maps for Kids
Amatria: Sentient Architecture
Teaching
Service
Contact
Email Katy
katy@indiana.edu
Email CNS Assistant
cnscntr@indiana.edu
Google Scholar
 Anyone
can learn to map data!
Anyone
can learn to map data!